CASE FILE · KM-04

Purchasing Data as Design Brief.

FashionIS sold 64,500 units in 2024, 99% of them to repeat customers, on a sales curve that stayed flat for eight months and spiked for two. The case needed a strategy that doubled as a design brief.

Quantitative Trend AnalysisPower BI & ExcelConsumer Behavior ResearchStrategic RecommendationsAI-Assisted DesignExecutive Presentation
Case File Snapshot
StakeholderPwC STEM Strategic Advisory Project • Case Project Simulated Client: FashionIS (Fictional Retailer)
RoleTravel Team Member, SIBC STEM Division Led 2-Person Sales Analytics Sub-Team within a 9-Person Team
Dataset10,000+ Retail Transactions • 64.5K Units Sold in 2024 Seasonal & Category-Level Purchasing Trends
MethodQuantitative Trend Analysis, AI-Assisted Design Mockups, Cross-Workstream Synthesis
OutputsPwC-Facing Strategic Presentation Recommendations Across Sales, Supply Chain & Inventory
Applied ValueTurns raw purchase data into a production-ready design and go-to-market strategy
The Story
The Question

FashionIS was selling well to the customers it already had. Could purchasing data show where the next collection should come from, and who it should reach?

The Tension

FashionIS wasn’t struggling to sell. 99% of purchases came from repeat customers, proof the product worked. But eight flat months followed by two enormous ones meant the business was living off holiday demand and an audience it already had.

The Insight

The data pointed toward one lever: turn the flattest months into the next launch window.

The System

The recommendation held together across four decisions:

  • TimingLaunch ahead of the holiday spike (late-August rollout), not during it.
  • Category FocusBuild the collaboration around jackets and footwear, the two highest-margin lines.
  • Partner SelectionPair with a recognizable performance-apparel brand to borrow reach FashionIS didn’t have organically.
  • ChannelPush the collaboration through social and digital channels, where FashionIS was underrepresented.
The Approach
01Case ScopingReviewed the PwC case brief for fictional retailer FashionIS and scoped the purchasing-data workstream within the 9-person team.
02Sub-Team FormationFormed and led a 2-person analytics sub-team responsible for the sales data workstream.
03Quantitative Data AnalysisAnalyzed 10,000+ sales data points in Power BI and Excel, surfacing the seasonal sales curve and category-level margins.
04Trend IdentificationIdentified jackets and footwear as the highest-margin, most under-expanded categories, and the holiday months as the window to design around.
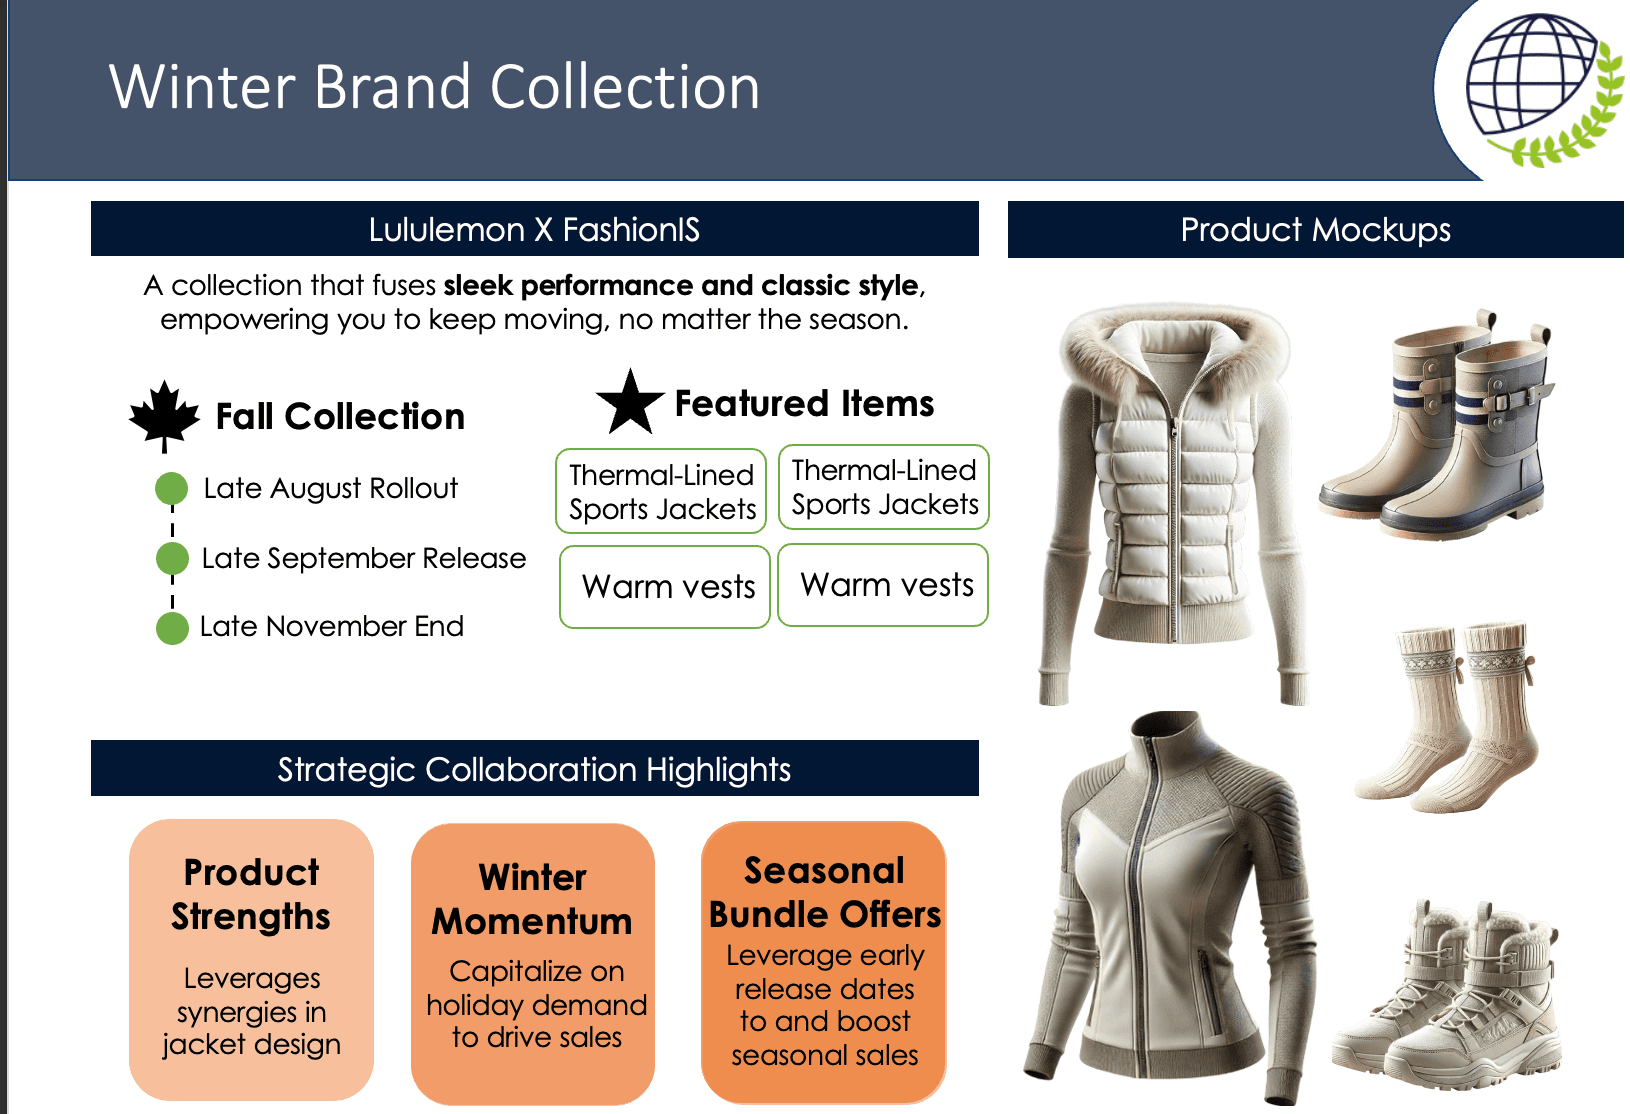
05Collaboration ConceptDesigned a seasonal collaboration concept, a co-branded winter jacket and footwear line, timed to launch ahead of the holiday sales spike.
06AI Mockup GenerationGenerated AI product mockups (thermal-lined jackets, vests, boots) to visualize the collaboration before recommending it.
07Executive PresentationPresented the sales strategy alongside the team’s supply chain and inventory recommendations to PwC senior professionals.
Tools (Secondary)
Power BIExcelAI Image Generation
Key Findings
InsightEvidenceStrategic Meaning
Sales were flat for eight months, then doubled and tripled.EvidenceMonthly sales held around 3,000 units from January through July, then rose to 9,000+ in August and 12,500+ in November and December.Strategic MeaningThe business was running on two months of holiday demand, not a full-year strategy.
FashionIS had loyalty, not reach.Evidence99% of purchases came from repeat customers, and only about 20% of sales happened online.Strategic MeaningGrowth had a ceiling. It needed new audiences, not just retention.
Jackets and footwear carried the business, and were under-stocked.EvidenceJackets and footwear alone drove about 70% of 2024 margin, but most shoe types shipped in just one style.Strategic MeaningThe highest-margin category had the least product variety. That’s a gap, not a ceiling.
Timing mattered more than markdowns.EvidenceSales spiked around new-season launches (August, November) rather than promotional periods.Strategic MeaningA collaboration timed ahead of the holiday spike would compound demand that was already coming.
A collaboration could buy the visibility loyalty alone couldn’t.EvidenceIndustry benchmarks showed a 30% lift in brand visibility from strategic collaborations, against $700B in global revenue running through social platforms.Strategic MeaningPartnering with a recognizable performance-apparel brand was the fastest way to reach customers who weren’t already buying in-store.
Output Preview
Winter Brand Collection slide proposing a co-branded seasonal jacket and footwear line with AI-generated product mockups
Winter Collection Concept · 1/3
Strategic Recommendations
Seasonal Collaboration Launch
Launch a co-branded winter collection with a performance-apparel partner, thermal-lined jackets and vests, timed to a late-August rollout so it’s live before the November demand spike.
Footwear Line Expansion
Expand footwear beyond one style per shoe type. It already drives roughly 40% of profit and a 54% average markup; the highest-margin category is also the least stocked.
Digital & Social Channel Growth
Shift marketing spend toward social and digital channels: FashionIS sells the majority of units in-store despite social commerce representing $700B in global revenue.

Selected slides from the final PwC strategic advisory presentation.

Ask Me About This Case →